Collection Analysis Report: A User's Guide
Introduction
The web-based Collection Analysis Report tool enables you to select and then analyze a particular section of the Yale University Library holdings in Orbis. This section is defined first by location and then by call number type and range. Using these parameters, a user can create their desired section and then analyze this section based on the following options: format, bibliographic encoding level, number of item records, circulations andor browses, date of last use and publication date.
Getting Started
- In your Internet browser, click on the link: Collection Analysis Report tool
- This will bring you to a login page. Login with your NetID and password.
- You are now ready to use the Collection Analysis Report tool.
Defining the Collection: Locations and Call Number Type
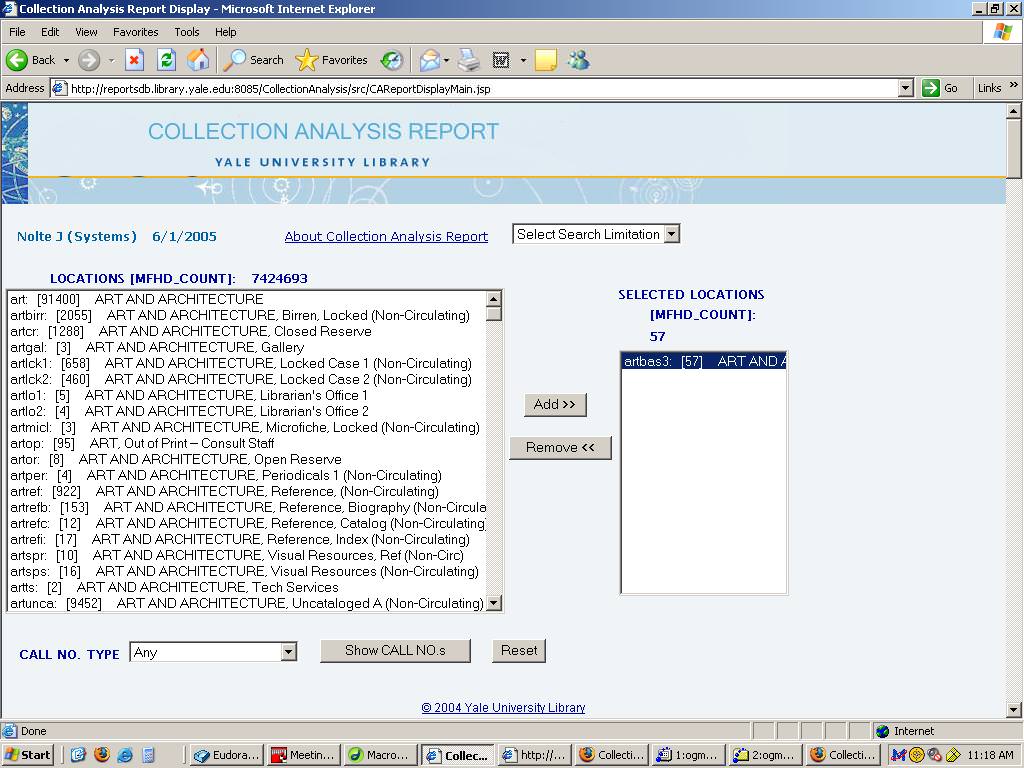
The first box lists all locations by location code (sml, ksl, art, etc.). In brackets is a count of the number of holdings records (MFHDs) currently in the database using that location. The full name of the location code follows. Click to select a single location. Use SHIFT+CLICK or CTRL+CLICK to select multiple locations. Use the Add ›› and Remove ‹‹ buttons to establish the locations in your collection subset. The MFHD count for all selected locations displays.
Now, select the CALL NO. TYPE. You can choose from three options:
- Any: Selects all call number types (you will rarely work with all call numbers).
- OTHER: will select call numbers encoded with a first indicator "8" in the 852 field of the MFHD. This includes all Old Yale Call numbers.
- Government Documents: This option will select SUDOC call numbers.
- Library of Congress
Now, click Show CALL NO.s to generate a list of call numbers found in the locations you selected. This operation will take some time depending on the size of the location code(s) selected. Be patient and wait for the browser to finish loading: resist the urge to press the button again, which will just start the process over from the beginning.
Narrowing the Search
Selecting a Call Number Range
When the browser has stopped loading and the tool has finished generating the list of call numbers look in the drop-down menu under CALL NO. RANGE. A list of all the call number classifications of the MFHD records in the location(s) you've already selected appears here. The count of MFHDs by format and encoding levels will also display.
Note: if your selected location(s) result in more than 2000 classes, the system will respond with a warning message, and not all of the results will display. If this happens, try to narrow your search further either by selecting fewer location codes or a different, narrower call number type. Use the SUBCLASS: text box to further define your selection- "0000" will put you at the beginning of a class range, "9999" will put you at the end of a class range.
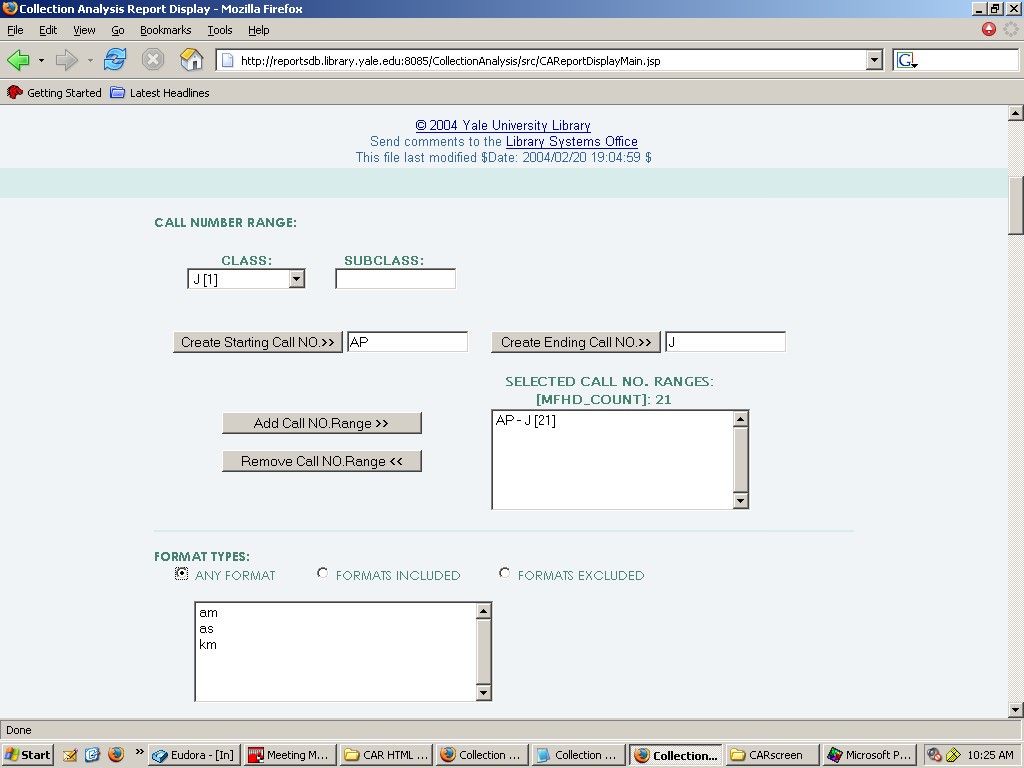
Select the call number range that you would like to analyze. From the CLASS drop-down list select your starting class. To add a decimal value to this class, enter the value in the CALL NO DECIMAL box. Click Add Starting Call No. Now select an ending class from the CALL NO CLASS drop-down list, add a decimal value if appropriate, and click Add Ending Call No. Once you are satisfied with your range, click Add›› to populate the SELECTED CALL NO RANGES box. Repeat the above steps to select additional ranges. Highlight ranges in the SELECTED CALL NO RANGES box and click REMOVE to de-select ranges.
Format Type, Encoding Level and Item Counts
* See the Leader and Directory pages on this MARC 21 page for format and encoding level values. Format combines character positions 06 with 07. Note that in the Collection Analysis Report tool encoding level [blank] is at the bottom of the list.
After selecting the desired call number range(s), note that there are seven other criteria available for narrowing and defining the report. The first three are Format Type, Encoding Level, and Item Count. All of the categories listed in the Collection Analysis Report tool are optional except for Format Type. If you do not click one of the buttons next to ANY FORMAT, FORMATS INCLUDED, or FORMATS EXCLUDED, the Collection Analysis Report tool will not display any results when you click the Show Collection Summary button at the bottom of the screen. Don't be alarmed- proceed to Displaying and Reading your Results.
NOTE: Selecting for LSF
The Library Shelving Facility staff has certain standards used to determine an item's eligibility to be sent to LSF, and the Collection Analysis Report tool can be used for searching the library system with these standards. Items with bibliographic records of Encoding level 5 ARE NOT eligible. All items must be properly cataloged before being sent to LSF. Additional criteria that do make an item eligible for transfer to LSF are:
Circs = 0-3 (between zero and three circulations)
Browses = 0-3 (between zero and three browses)
Last Date Used = earlier than 1999
Date of Publication = earlier than 1999
Format = am (monographs)
Language = All
Place of Publication = All
* For more specific information on the Library Shelving Facility and its policies on selection, go to http://www.library.yale.edu/lsf/transfers.html
Sorting by Circulation Statistics
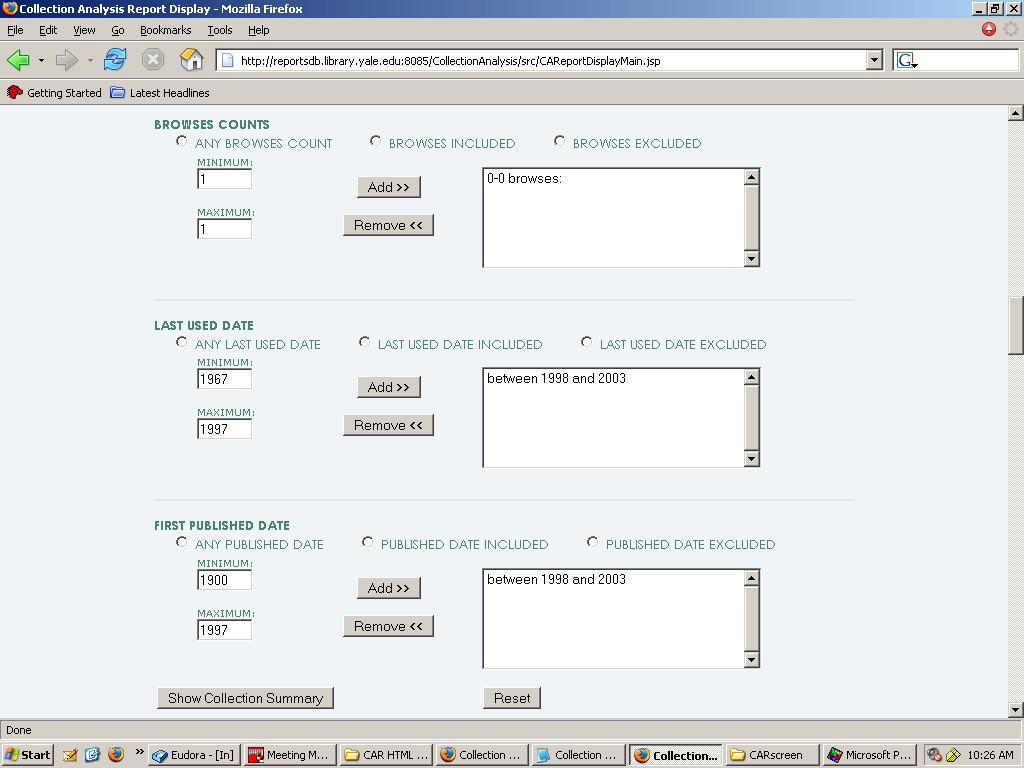
The next categories to search under have to do with circulation statistics. These are: number of circulations, number of browses, date of last use and publication dates. Choose which categories you wish to sort under and establish a threshold for each (example: 5 circulations). Indicate whether the tool should include or exclude material with the established counts. If you want to see a breakdown of items by number of circulations, browses, etc. without setting a threshold, click the ANY option. If you do not care about sorting your results under any of the additional categories (item counts, number of circulations, number of browses, date of last use and publication dates) go immediately to the bottom of the screen and click the Show Collection Summary button. This step will take some time to complete, depending on the size of the sample. Again, let the browser finish loading and resist the urge to click the button a second time. Note, as well, that all of the processing is being done by the server, not your computer, so there is no need to limit your activity on your workstation while this is running.
Displaying and Reading your Results
The Collection Analysis Report tool will return counts of the number of MFHDs within your selected slice broken down by counts in the categories you selected. Reset and change your options to re-analyze the collection until you have the results you want. Once you have established the correct location, call number, format and encoding level selections, and you have set appropriate thresholds, List the collection to see the selected material immediately or Export Delimited File to create a pipe ( | ) delimited file of the selected records. When you List the collection, a ![]() summary screen presents your analysis parameters, as well as a
summary screen presents your analysis parameters, as well as a ![]() pipe-delimited list of your results. You can also click Show Query to see the SQL behind your selection (useful for debugging). Click Export Serials Delimited File to create a pipe ( | ) delimited file with information pertinent to serials, such as succeeding entries and barcodes.
pipe-delimited list of your results. You can also click Show Query to see the SQL behind your selection (useful for debugging). Click Export Serials Delimited File to create a pipe ( | ) delimited file with information pertinent to serials, such as succeeding entries and barcodes.
Data elements displayed in the exported Delimited File include:
- location
- temp location
- normalized call number
- display call number
- format
- author
- title
- imprint
- beginning publication year (taken from fixed field in bib)
- physical description
- last circulation date
- number of charges
- number of browses
- MFHD record id
- bib record id
- and
- item record id.
Data elements displayed in the exported Serials Delimited File include:
- display call number
- author
- title
- imprint
- physical description
- succeeding entry
- date type
- holdings
- bib record id
- MFHD record id
- barcode
- location
- and
- temp location
Exporting the Report into Excel
To download the report in Excel form, click the Export button at the bottom of the page. This may take a few minutes, depending on the size of your results. You will be prompted to save the file; click Save and then specify where you want to save the file on your PC and click save again. Open Excel and choose File>>Open. Find the file you just downloaded (remember to choose All Files in the Files of type menu) and click Open. The Text Import Wizard should now open. Choose Delimited and click Next. Now choose Other, and in the text box type a pipe ( | ) by holding down the SHIFT key and then typing a frontslash ( \ ), then click Next. At the last screen, click on whatever columns you do not want in your spreadsheet and click "Do not import column (skip)." If you don't want to skip any columns, click Finish.
To save this file as an Excel file, go to File>>Save As, choose the file name and under Save as type, select Microsoft Excel Workbook (*.xls). Click Save.