Library IT Satisfaction Survey 2014
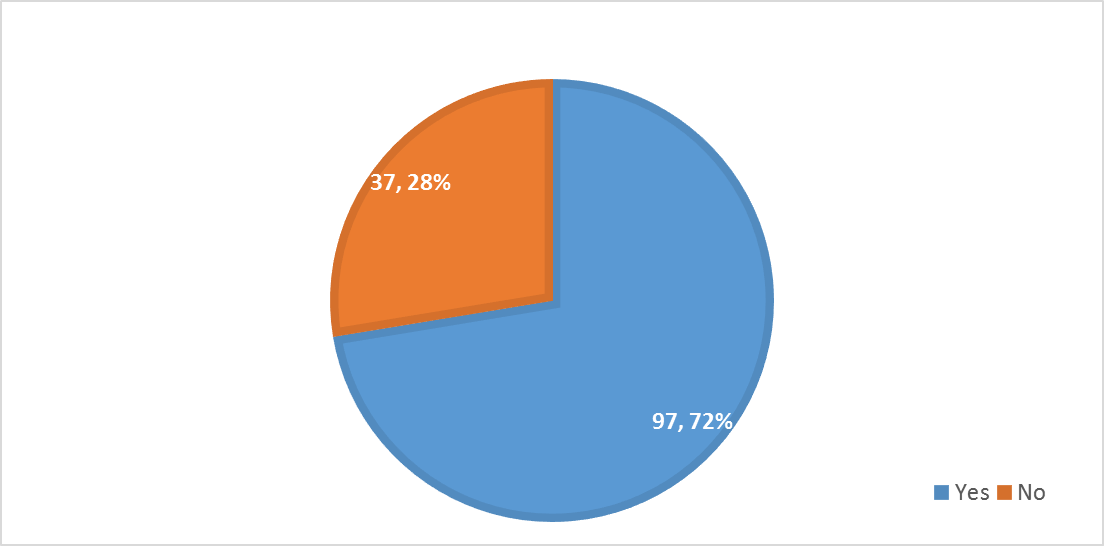
The LIT Satisfaction Survey was delivered in September 2014. The online survey was sent to the Library YULIB email list, and 162 library staff members finished the survey. Most (96%) considered themselves consumers of library IT services.
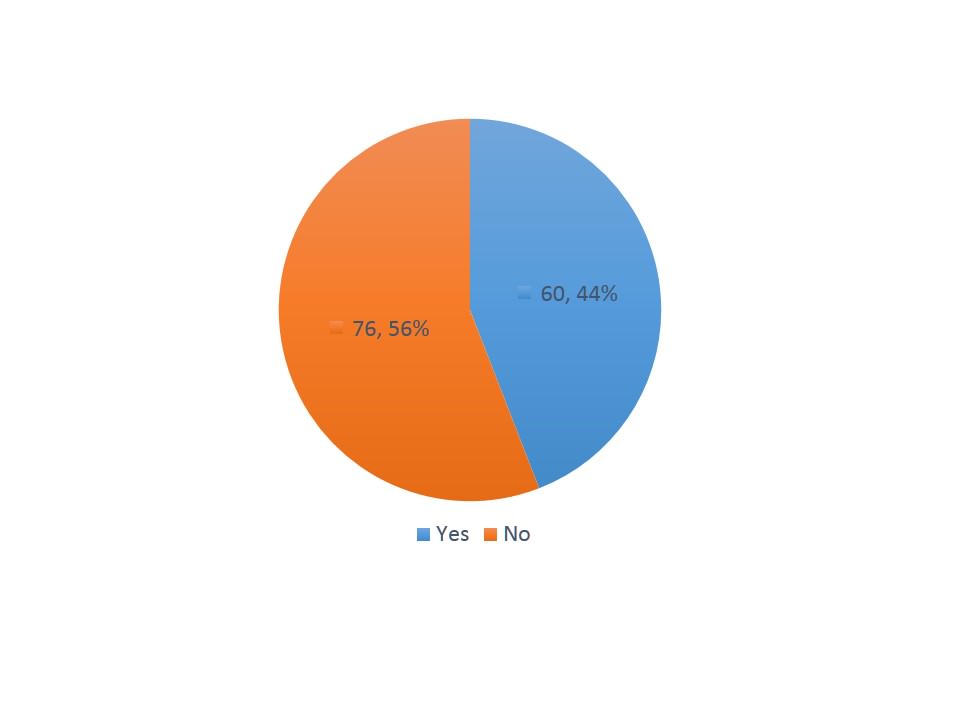
Do you use the services of Library IT (LIT)?
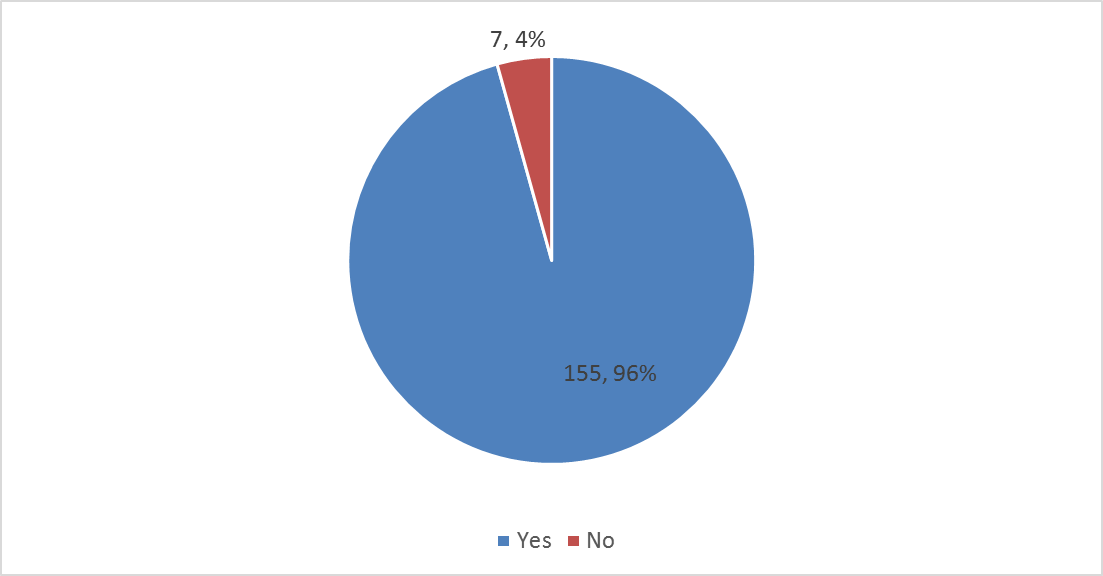
Format note: the pie chart above shows the raw number of responses, comma, and the percent.
General Results
In your opinion, has LIT's overall performance improved,stayed the same, or worsened in the past year?
153 answered; 50% said LIT's performance stayed the same.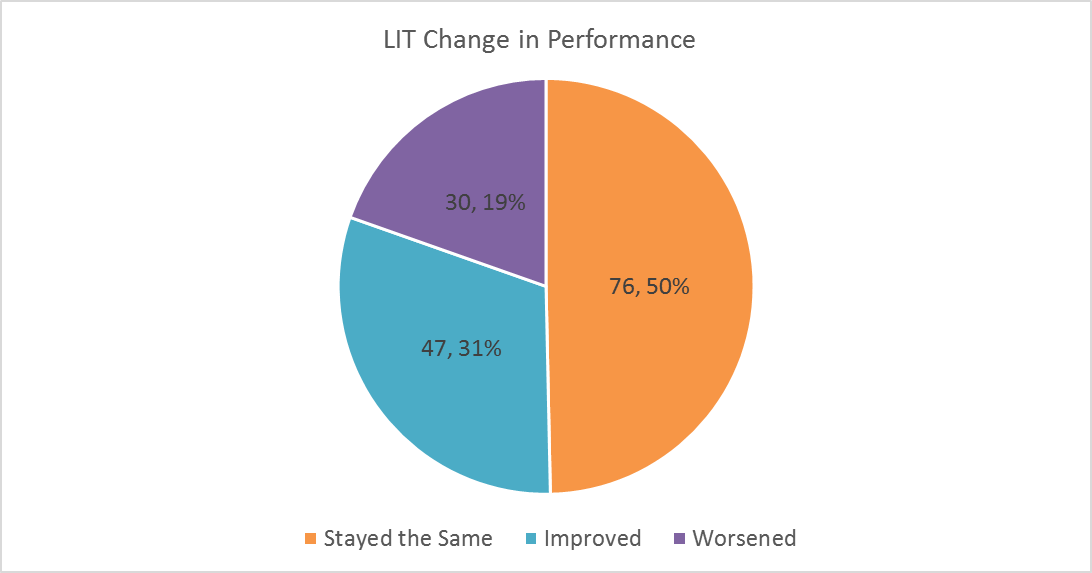
Satisfaction with the Overall Performance of LIT
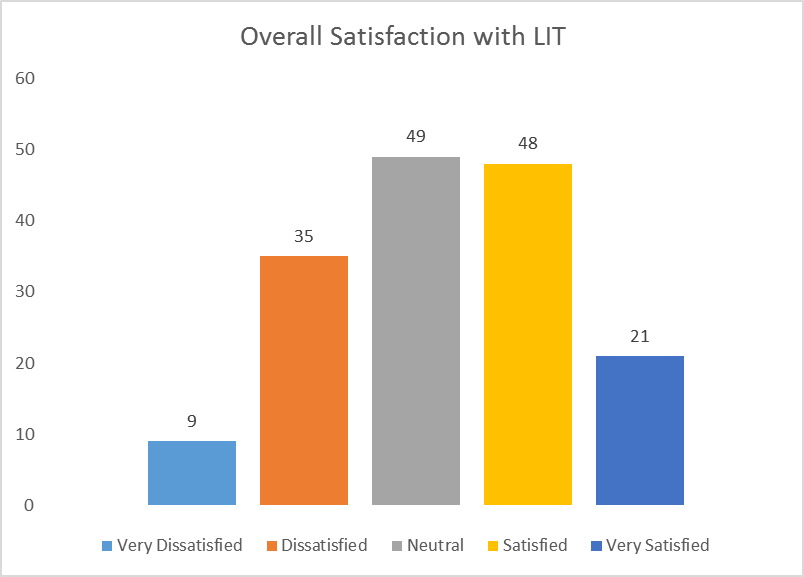
Overall, how satisfied are you with Yale Library Information Technology (LIT)?
Respondents were asked how satisfied they are with IT services, and rated on a scale from Very Dissatisfied (1) to Very Satisfied (5). The most common rating was Neutral (49 responses), 42.6% were either satisfied or very satisfied. The average for all responses was slightly higher than neutral, 3.2. 162 respondents answered.
Communication
Respondents were asked about the ways LIT communicates with the Library. Respondents were asked about the new LIT web site, and also about their level of satisfaction with different communication methods.
Have you used the new LIT web site http://web.library.yale.edu/lit [1]?
136 answered, and more respondents had not used the web site.
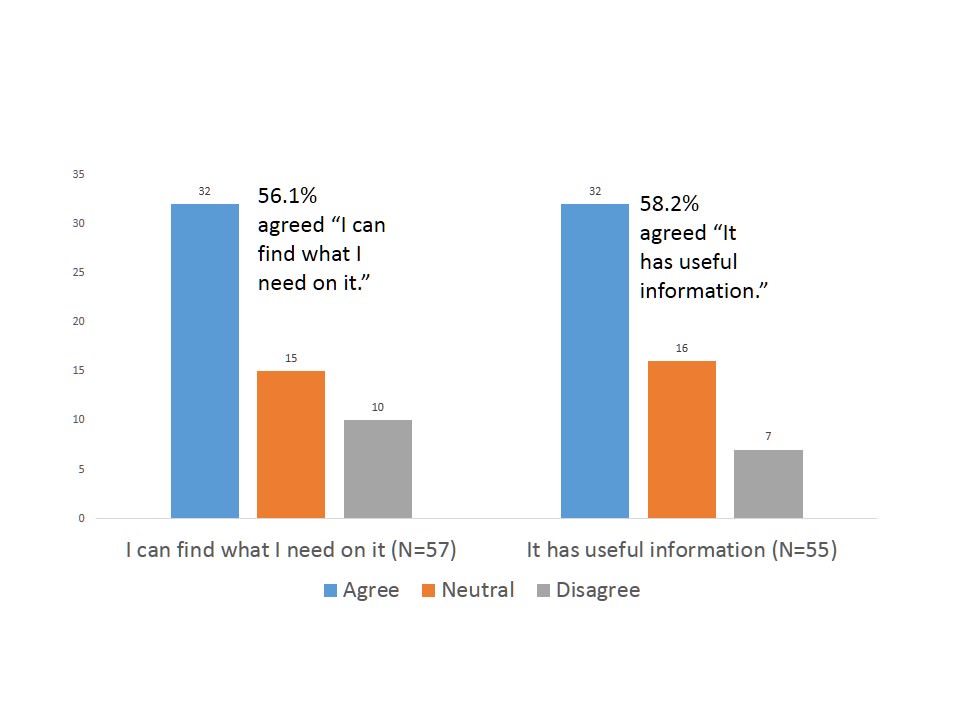
Please indicate your agreement/disagreement with each statement about the new LIT web site page http:// [1]web.library.yale.edu/lit [1]
Communication: LIT reaches out to the library in a variety of ways. Please rate your satisfaction with each…
LIT uses a variety of ways to communicate with the Library, and respondents were asked to comment on each. The average scores (rated from 1=very dissatisfied to 5 very satisfied) were all very close, but there was a greater spread in the percent of people who were satisfied or very satisfied. The LIT Newsletter had the slightly highest average satisfaction score, but a significantly high percentage of people who were satisfied or very satisfied. 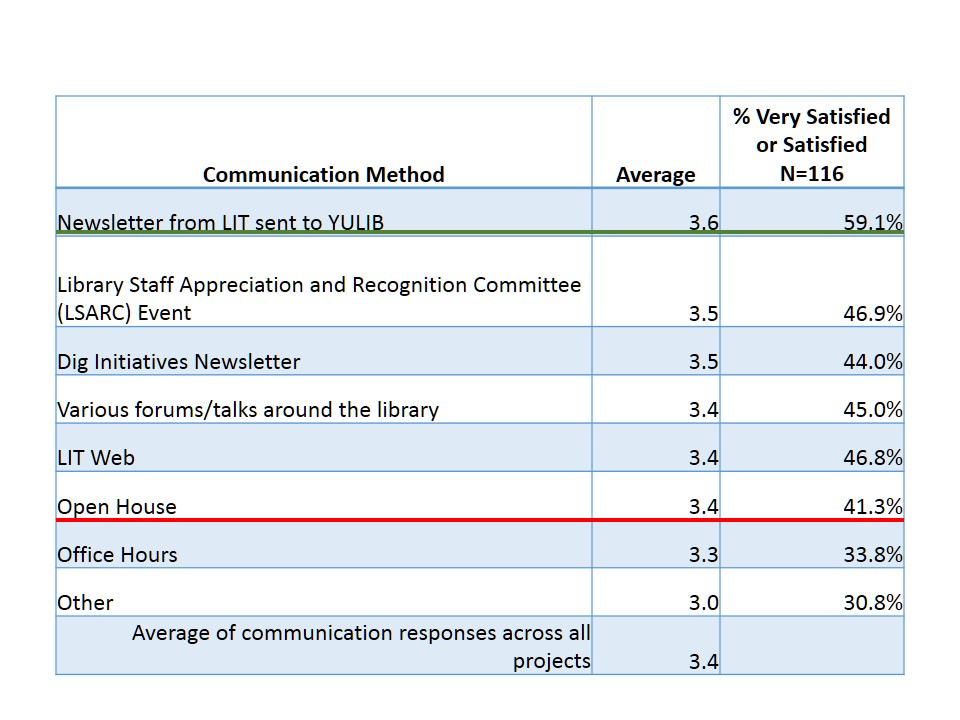
All Projects -- Awareness
The survey asked about 13 projects or services the LIT department worked on in 2014.
Please indicate if you have been actively involved in or were aware of various services related to ...
No one project was recognized by more then half respondents as being something they were aware of or involved with. The average level of recognition across all projects listed was 31.5%. Projects are listed in descending order of percentage of respondents indicating they were aware of or involved with the project. In this chart those projects with a higher percent aware or involved with are shown above the green line, and those with less than the average are below the red line.
Communication by Project
How satisfied have you been with communication?
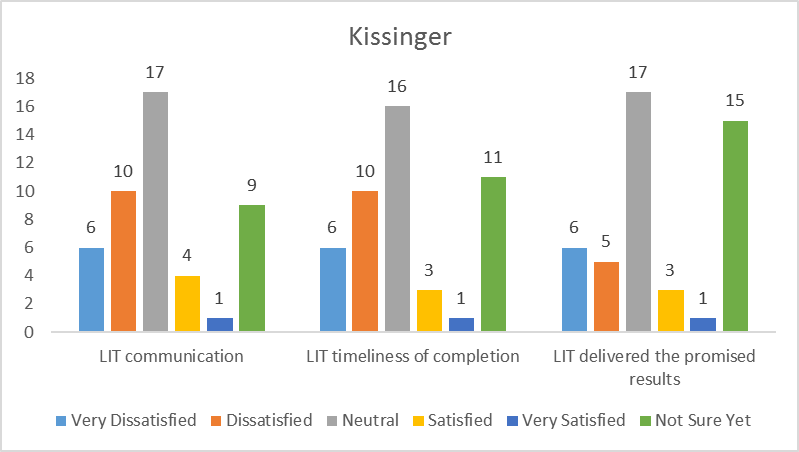
If a respondent was aware of a or involved with a project, they were asked about three aspects of LIT's performance: communication, timeliness of completion, and delivered the promised functionality.
Respondents rated communication on a scale from Very Dissatisfied (1) to Very Satisfied (5). The average response across all projects was slightly above neutral, 3.2. The table below lists the average score for each project, and also the percent indicating they were satisfied or very satisfied. The chart displays those projects with in descending order of average satisfaction. Those projects above the green line are the top third of the average score for communication.

Functionality by Project
Respondents who were aware of or involved with a project were asked how well Library IT did delivering the functionality promised.

Timeliness of Completion by Project

Projects
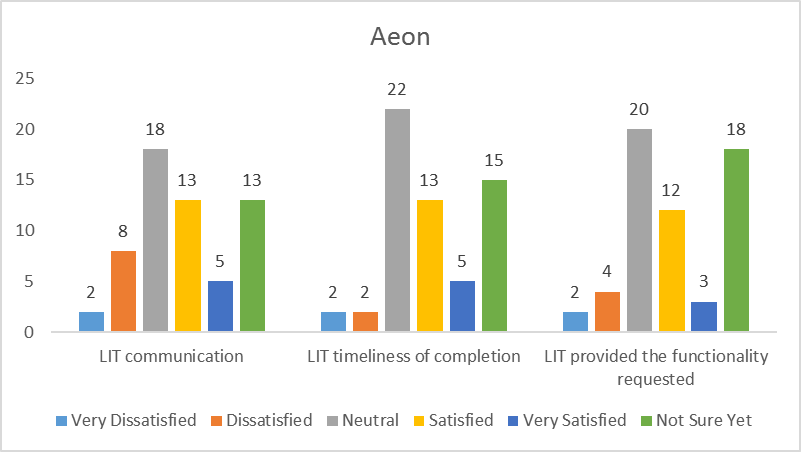
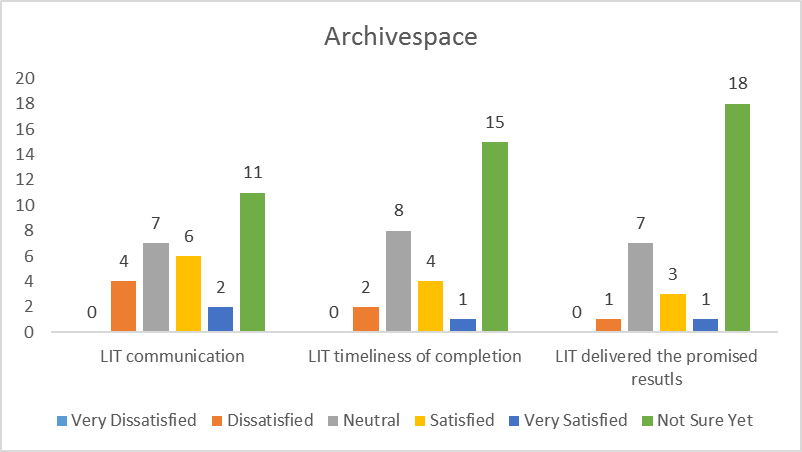
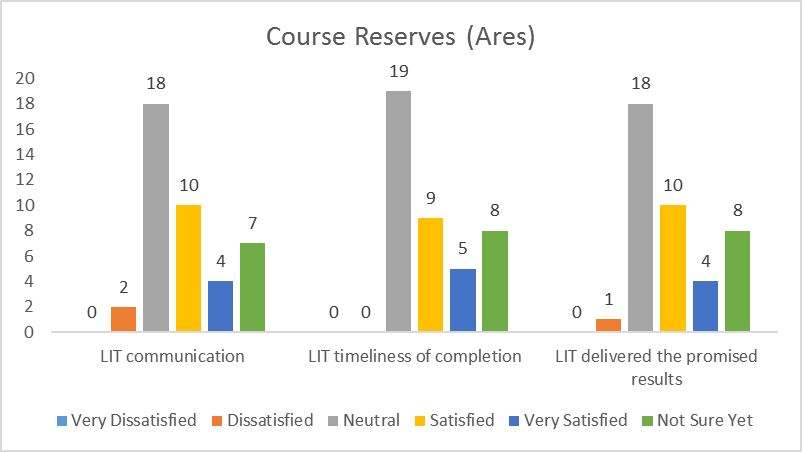
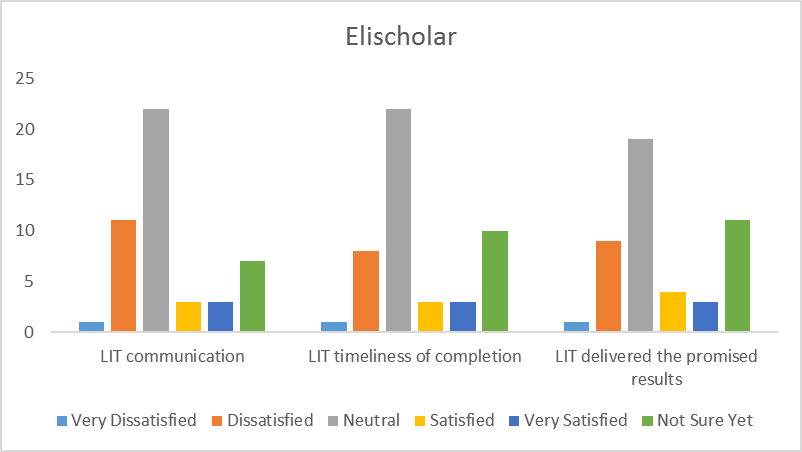
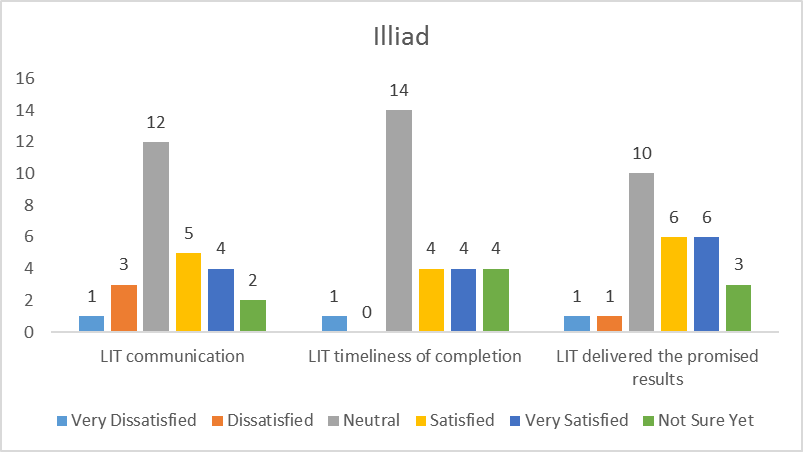
Respondents were asked about a series of projects that Library IT has been involved with in 2013-2014. If they indicated they were aware of a project or involved somehow, they were then shown a set of three more questions asking to rate how well they thought LIT did communicating about the project, delivering what was promised, and the timeliness of completion. All were scored on a scale from very dissatisfied (1) to very satisfied (5).
Aeon
59 respondents were aware of or actively involved in the Aeon project.
Archivespace
33 respondents were aware of or actively involved with the Archivespace project.
Articles+
64 respondents were aware of or actively involved with the project to implement Articles+ (Summon).

Course Reserves (Ares)
46 respondents were aware of or actively involved with the implementation of course reserves (Ares).
Elischolar
47 respondents were aware of or actively involved in the Elischolar project.
Finding Aids
45 respondents were aware of or actively involved with the finding aids project.

Findit for Digitized Objects
32 Respondents were aware of or actively involved in the project to digitize material and build the Findit interface for search and access.

Fortunoff Project
47 Respondents were aware of or involved with the Fortunoff Project.

Illiad
30 respondents were aware of or involved with the project to upgrade to a new version of ILLiad.
Kissinger Project
52 respondents were aware of or involved in the Kissinger project.
Libguides
65 respondents were aware of or involved with the project to upgrade Libguides.

Voyager Services
60 Respondents were aware of or actively involved in working with LIT on Voyager services.

Web Migration
67 respondents were aware of or actively involved with the move of materials to a new web server.

Comments
There seemed to be general knowledge of the web migration among staff. The reaction to the project was fairly neutral, and neither judged overly good or bad. Comments indicated that for many people the length of the time needed for web migration was too long.
One comment noted the general lack of available guidelines for staff.
Web Migration Response and Plans
Migration Schedule
The User Experience Department agrees with some of the comments that the web migration has gone on for too long and it is time to finish it. Most of the high use material has moved, but work remains. With the arrival of a new Web Manager work can accelerate in Spring 2015. Major work to be completed by July 2015:
- All exhibits will be reviewed for quality and use. Exhibits will either be migrated to Omeka or retired.
- Maps and the Lewis Walpole collection pages will be migrated to YaleSites.
- News items and the news archive will move to YaleSites.
- Subject librarians pages will be migrated and better integrated with Personal Librarians.
- All cataloging instructional content will move to YaleSites or Sharepoint.
Anyone with a concern about content that they know is on the old web server for which there is no planned migration should contact Steven Wieda or Meng Tang as soon as possible.
Guidelines for Usability and Accessibility
While only one person noted it, it is true that there is a lack of good, clear guidelines for staff, both for basic "how to" and also guidelines to help people create effective, usable web sites. This year we plan to improve our documentation. We have started a documentation site [2]and will add to it and enhance it.
Training
There has been a lack of formal training. With most material moved to YaleSites, and with guidelines in place, staff should be empowered to have more control over editing their own web sites. To that end we will recommend a training program aimed at different levels of staff. We will work with ITS to ensure that staff have opportunities during the year to take classes in
- Writing for the web
- Usability and accessibility guidelines for the library web sites
- Using Google Analytics
Workstation Support
The survey asked staff to consider the services offered by Workstation Support, a unit within LIT. Most respondents agreed that they "understand how the work of this group fits with or supports the work of my department.
Note that in the pie chart above the display shows the raw number of responses, comma, and then the percent.
The survey also asked respondents to indicate how frequently they used the services of Workstation Support to help with their computer, asst and general IT infrastucture and software support.
The survey also asked respondents to indicate satisfaction (from 1=Very Dissatisfied to 5 Ver Dissatisfied) in these same three areas.

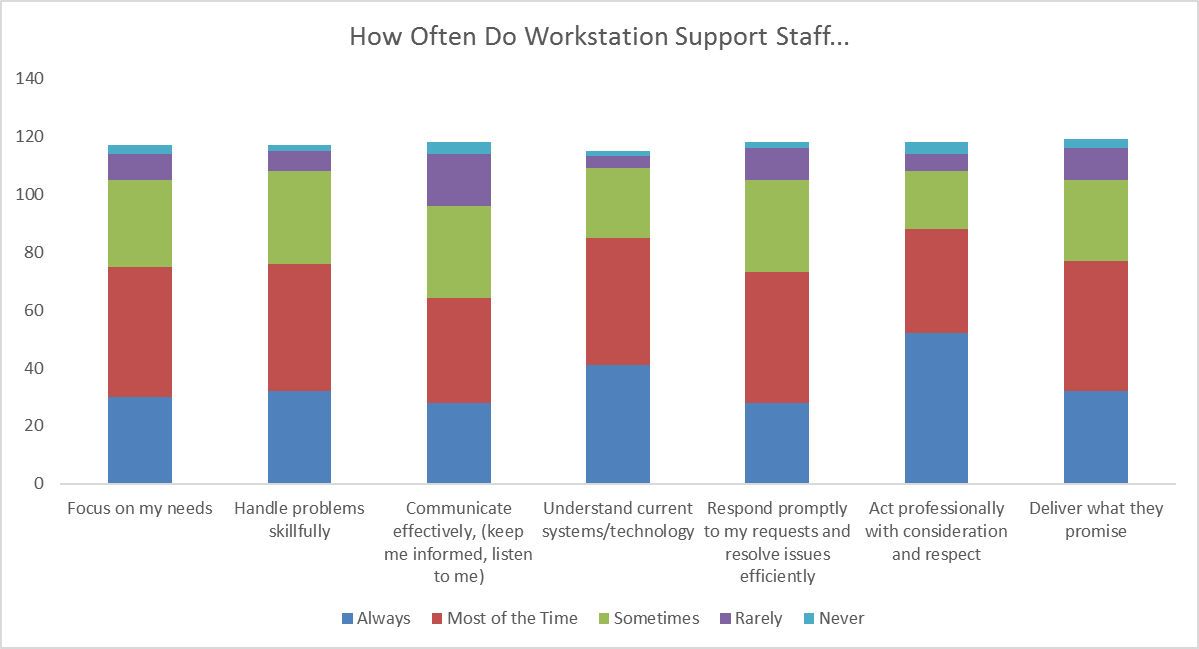
Workstation Support Staff Behaviors
The survey asked respondents to consider seven behaviors that Workstation Support staff should exhibit, and then to rate how often staff exhibited that behavior. Frequency scale used was 1=Never, 2= Rarely, 3=Sometimes, 4=Often and 5 = Always.
| Average | # Responses | |
| Act professionally with consideration and respect | 4.1 | 118 |
| Understand current systems/technology | 4.0 | 115 |
| Handle problems skillfully | 3.8 | 117 |
| Deliver what they promise | 3.8 | 119 |
| Focus on my needs | 3.8 | 117 |
| Respond promptly to my requests and resolve issues efficiently | 3.7 | 118 |
| Communicate effectively, (keep me informed, listen to me) | 3.6 | 118 |